-
 Census 2021 Data
 -
 Homes & Property
 -
 Law and Order
 -
 Jobs & Economy
 -
 Learning & Schools
 -
 Essential Services
 -
 Travel & Transport
 -
 Local Amenities
 -
 Leisure & Recreation
 -
 Environment
Yield
Wood Lane, West Alvington, Kingsbridge, South Hams, Devon
TQ7 3PH South Hams District
This section gives the estimated property yield for the postcode based on our own unique algorithms, comparing it to the national average. We analyse gigabytes of data to explore why yields might be higher, lower, or in line with expectations. From local market trends to demand and property types, the data paints a clear picture of investment potential in TQ7 3PH.
Estimated yield for property investors
3.2%
Yield
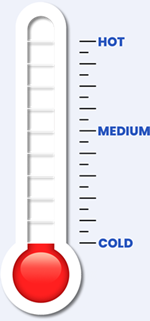
The estimated yield for the TQ7 3PH postcode area is 3.2%, which is lower than the national average yield of 3.8%.
Summary
The TQ7 3PH area has a lower yield, but its high safety score makes it a stable, if not lucrative, investment option - in the long term. Investors seeking long-term stability rather than high returns might find this area appealing.
Property yields in TQ7 3PH are lower than average, which might reflect a more mature or stable market where opportunities for high returns are limited.
However, the high safety score adds value to the area, potentially attracting long-term tenants or buyers who prioritixe security, making it a stable investment option.
The less urban nature of TQ7 3PH suggests a more suburban or rural setting, which could mean lower rental demand but potentially higher property values if the area is considered desirable for homebuyers.
With a lower ownership rate, the area might offer more rental opportunities, but investors should consider whether demand is driven by the convenience of renting or a lack of affordability in purchasing.
Factors affecting yield in TQ7 3PH
Understanding property yield involves considering various factors like affordability, income, and crime rates. These elements influence rental demand, property values, and ultimately, the return on investment.
Property Yield (%)
This is the return on investment from a property, typically calculated by dividing annual rental income by the property's value. A higher yield in TQ7 3PH suggests better profitability, influenced by local demand, property prices, and rental rates.
Property Affordability
Property affordability is gauged by comparing housing prices to average earnings in TQ7 3PH. In regions where affordability is low, yields might increase due to higher rents, but buyer interest could be subdued, influencing long-term appreciation.
Rental Affordability
This evaluates how much of a household's income is dedicated to rent for people in TQ7 3PH. High rental costs relative to income could weaken tenant demand, reducing yield. In contrast, affordable rent can attract tenants who stay longer, ensuring a more stable yield.
Household Income
Higher household income generally means residents can afford higher rents in TQ7 3PH, which can lead to better yields. However, in more affluent areas, property prices might also be higher, which could lower the yield percentage despite strong rental income.
Urban Location
Urban areas usually see higher yields thanks to robust rental demand, particularly in cities with a young, transient population. However, the high property prices common in urban settings can lower the yield percentage despite strong rental returns.
Employment Score
When unemployment levels are high, it can signal economic instability, leading to reduced rental demand and higher vacancies, which can decrease yield. Low unemployment usually indicates economic stability, resulting in higher rental demand and better yields.
Outright Ownership
A high percentage of outright property ownership can suggest a stable, established community with less rental demand, possibly lowering yields. Conversely, areas with fewer outright owners might have more rental properties, leading to higher demand and potentially better yields.
Crime & Safety Levels
High crime rates can deter renters, reduce property values, and lead to lower yields. Conversely, low crime rates make areas more attractive to renters and buyers, boosting both rental income and property value, which can enhance yield.
Best Performing Yields
The following postcodes within the TQ7 location current have the highest performing yields:
Methodology
Our property yield estimates are derived from a custom algorithm built by PostcodeArea that combines data from the Census 2021 and other reliable third-party sources.
This algorithm evaluates several key factors - including affordability, rental affordability, household income, urbanisation, unemployment rates, property ownership levels, and safety. We do this by assigning weighted scores to each factor. These factors are chosen for their relevance to property investment, with the yield percentage itself carrying the most weight due to its direct impact on potential returns.
The algorithm also incorporates conditional logic to assess how different combinations of these factors might influence property yield. For example, a neighbourhood with high rental affordability and strong income levels might indicate robust rental demand, leading to higher yields.
Conversely, areas with high unemployment and low income could see reduced rental demand, potentially lowering yields.
By considering these interactions, the algorithm provides a more nuanced estimate than simple averages or single-factor analyses.
It's important to note that these yield figures are general estimates intended as a guide rather than precise calculations. While the algorithm offers valuable insights based on historical and statistical data, it may not fully capture the unique aspects of each neighbourhood or current market conditions.
Investors should use this information as a starting point for further analysis and consider it alongside other factors such as market trends and personal financial goals.


