-
 Census 2021 Data
 -
 Homes & Property
 -
 Law and Order
 -
 Jobs & Economy
 -
 Learning & Schools
 -
 Essential Services
 -
 Travel & Transport
 -
 Local Amenities
 -
 Leisure & Recreation
 -
 Environment
Yield
Bridge Street, Uttoxeter
ST14 8AW East Staffordshire District (B)
This section gives the estimated property yield for the postcode based on our own unique algorithms, comparing it to the national average. We analyse gigabytes of data to explore why yields might be higher, lower, or in line with expectations. From local market trends to demand and property types, the data paints a clear picture of investment potential in ST14 8AW.
Estimated yield for property investors
5.2%
Yield
The estimated yield for the ST14 8AW postcode area is 5.2%, which is higher than the national average yield of 3.8%.
Summary
Property yields in ST14 8AW are lower than average, which might reflect a more mature or stable market where opportunities for high returns are limited.
The combination of lower yields and moderate safety might indicate that the area is less desirable for high-return investments, though it could still appeal to those seeking stable, long-term growth.
The urban nature of ST14 8AW suggests that the area is well-connected and densely populated, which typically correlates with strong rental demand and potentially higher yields.
With a lower rate of home ownership, the rental market in ST14 8AW is likely more active, offering greater opportunities for investors to capitalise on demand.
Despite the urban appeal, a lower safety score might deter some potential tenants, which could impact rental demand and yield stability.
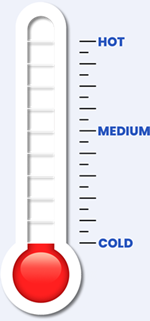
Factors affecting yield in ST14 8AW
Understanding property yield involves considering various factors like affordability, income, and crime rates. These elements influence rental demand, property values, and ultimately, the return on investment.
Property Yield (%)
Yield represents the income earned from a property as a percentage of its value. A higher yield in ST14 8AW indicates a more lucrative investment, shaped by factors like rental income, property costs, and local market conditions.
Property Affordability
Affordability looks at the balance between property prices and local incomes. Areas with low affordability might experience higher rents, which could raise yields but might also limit the pool of potential buyers, impacting long-term values.
Rental Affordability
This measures the fraction of household income in ST14 8AW is allocated to rent. If rent is too high, tenant demand may fall, impacting yield. Balanced rent-to-income ratios, however, can attract tenants who are likely to stay longer, providing stable yields.
Household Income
Greater household income generally enables residents to pay more in rent, which could enhance yields. However, in wealthier areas, the higher property prices might lower the yield percentage despite strong rental income.
Urban Location
Higher yields are common in urban areas due to strong renter demand, especially in cities with a young and mobile workforce. Yet, higher property prices in these regions can reduce the yield percentage, balancing out the rental income.
Employment Score
Unemployment is a key economic indicator; low employment levels can reduce rental demand and raise vacancy rates, negatively affecting yields. High employment usually signals a stable economy, leading to stronger rental demand and better yields.
Outright Ownership
Communities with high levels of outright home ownership are usually more stable, with less rental demand, which might lower yields. Areas with fewer outright owners may have a higher proportion of rental properties, leading to better yields.
Crime & Safety Levels
High crime levels can discourage renters, decrease property values, and result in lower yields. In contrast, low crime rates make an area more desirable, driving up rental demand and property values, which can enhance yields.
Best Performing Yields
The following postcodes within the ST14 location current have the highest performing yields:
Methodology
Our property yield estimates are derived from a custom algorithm built by PostcodeArea that combines data from the Census 2021 and other reliable third-party sources.
This algorithm evaluates several key factors - including affordability, rental affordability, household income, urbanisation, unemployment rates, property ownership levels, and safety. We do this by assigning weighted scores to each factor. These factors are chosen for their relevance to property investment, with the yield percentage itself carrying the most weight due to its direct impact on potential returns.
The algorithm also incorporates conditional logic to assess how different combinations of these factors might influence property yield. For example, a neighbourhood with high rental affordability and strong income levels might indicate robust rental demand, leading to higher yields.
Conversely, areas with high unemployment and low income could see reduced rental demand, potentially lowering yields.
By considering these interactions, the algorithm provides a more nuanced estimate than simple averages or single-factor analyses.
It's important to note that these yield figures are general estimates intended as a guide rather than precise calculations. While the algorithm offers valuable insights based on historical and statistical data, it may not fully capture the unique aspects of each neighbourhood or current market conditions.
Investors should use this information as a starting point for further analysis and consider it alongside other factors such as market trends and personal financial goals.


