N11 (London)
London Postcode Area
London, the heart of Greater London, is a diverse metropolis offering a unique living experience across its neighbourhoods. Each area, from the historic charm of Greenwich to the trendy vibes of Shoreditch, boasts rich cultural heritage and modern amenities. With an extensive transport network, residents enjoy easy access to iconic attractions like the Tower of London and the British Museum. Expect lively markets, green parks, and a culinary scene, making London an exciting place to call home.
Overview
London (N11) postcode district is located in the ceremonial county of Greater London, and is part of the London postal town.
The N11 postcode, located in the London district of North London, is an affluent and diverse area known as 'New Southgate'. Key statistics include an average house price of £838,750, a population density of 4811.9 people per sq km, and a higher than average number of cars per household at 1.9. The area boasts a strong educational background, with 46.4% of residents holding Level 4 qualifications, and a multicultural community with 58.6% identifying as White.
Settlements within N11 include:
Bowes Park, Brunswick Park, Friern Barnet, New Southgate, Osidge

People and Demographics
Demographics
N11 is a vibrant and multicultural area, with a population density of 4811.9 people per sq km, significantly higher than the national average of 394.6. The average age of residents is 38.2 years, which is slightly younger than the UK average of 40.7. The ethnic breakdown shows a diverse community, with 58.6% White, 16.2% Asian, and 9.9% Black residents.
Unemployment
Percentage of people in London N11 who are classed as being unemployed at Census 2021.
An unemployment rate of 5% in London N11 is slightly above the UK average of 4.3%, indicating a moderate level of joblessness.
While some residents may face employment challenges, the rate still suggests a functioning local economy. Efforts to boost job opportunities could further enhance community stability and support the area's long-term growth.
Diversity
Percentage of residents in the N11 postcode region who identify as white.
With 59% of residents identifying as White in London N11, this postcode has a diverse community with a slight majority of White residents.
The mix of different ethnic backgrounds adds to the neighbourhood's character, offering opportunities for cultural engagement and mutual understanding among residents.
Population Growth
Population growth means that the population of London N11 is increasing by 2% each year.
Across the UK, (England, Scotland, Northern Ireland and Wales), the average population grown from 2023-2024 is 0.66%.
Children
Are under 18 years old
20% of London N11 are under the age of 18 at the time of the Census 2021.
London N11 aligns closely with the UK average of 17.4%. This indicates a balanced mix of families and other household types, with amenities catering to both children and adults.
Retired
Are enjoying retirement
15% of London N11 are retired at the time of the Census 2021.
London N11 aligns closely with the UK average of 16%, a mixed community of working-age individuals and retirees. Local amenities are likely to be diverse, and cater to both younger and older residents.
Census 2021 Demographics
Who lives and works in N11?
Analysing the N11 population's characteristics, including age distribution and cultural diversity, provides valuable insights into the composition of the community.

Population
Analysing the N11 population's characteristics, including age distribution and cultural diversity provides valuable insights into the composition of a local community.
Demographics
N11 is a vibrant and multicultural area, with a population density of 4811.9 people per sq km, significantly higher than the national average of 394.6. The average age of residents is 38.2 years, which is slightly younger than the UK average of 40.7. The ethnic breakdown shows a diverse community, with 58.6% White, 16.2% Asian, and 9.9% Black residents.
Population Growth
Population growth means that the population of London N11 is increasing by 2% each year.
Across the UK, (England, Scotland, Northern Ireland and Wales), the average population grown from 2023-2024 is 0.66%.
Children
of London N11 are under the age of 18 at the time of the Census 2021.
Retired
of London N11 are retired at the time of the Census 2021.
Gender Ratio
51% female
Gender ratio in census data means the number of males for every 100 females in a population, helping us understand the balance between men and women in a specific area.
Age Distribution
are adults
Age distribution refers to how different age groups are spread within a population, showing the number of people in each age range. This helps understand the population's structure and potential needs.
Age Distribution
"Age Distribution by 5-year bands" in the Census 2021 breaks down the population into groups based on age ranges, each spanning five years (e.g., 0-4, 5-9, 10-14, etc.). This helps to see how many people fall into each age group, providing a clear picture of the age structure in an area.
Living Arrangements
"Living Arrangements" in the Census 2021 refers to people's relationship status and how they live with others. It includes whether someone is married, in a civil partnership, cohabiting as a couple, separated, divorced, or single, and whether they live with a partner, alone, or with others.
Legal Partnership
Legal partnership status of residents in the London (N11) district, offering insights into the diversity of relationship statuses in the area. This dataset classifies residents aged 16+ in England & Wales by their partnership status.
Gender Identity
"Gender Identity" in the Census 2021 refers to how people personally identify their gender, which may or may not align with the sex they were assigned at birth. It includes options like male, female, non-binary, or other identities, reflecting how individuals see themselves.
Postcodes
Dig even deeper into the N11 postcode:
Click on an postal code below for more information about the area. Each postcode give you a comprehensive overview of the postcode neighbourhood, including address, demographics, crime, transport, amenities and house prices in London (N11).
Word Cloud for N11
We've trawled social media and the web to discover words that describe the postcode district of N11:
Nearby Towns & Cities
N11 Postcode area
The following towns and villages can be found close to London N11:
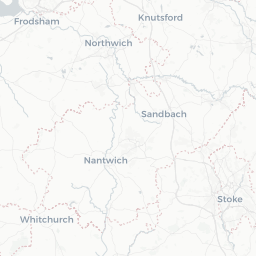
Westminster
Population 218,791
3.3 miles
Westminster, with its iconic landmarks like Big Ben and Buckingham Palace, offers a rich blend of history, culture, and vibrant city living, making it the perfect place to immerse yourself in the heart of London while enjoying a diverse range of amenities and attractions on your doorstep.
Nearest Postcode Areas:
London
Population 8,173,941
6.5 miles
The capital of England and most populous city in the United Kingdom, London stands on the River Thames, and has been a major settlement for two millennia. A metropolis of arts, culture, sport and entertainment are sure to delight all.
Nearest Postcode Areas:
Chigwell
Population 10,365
9 miles
Located in the beautiful county of Essex, Chigwell offers a blend of picturesque countryside living and vibrant urban amenities, making it a sought-after town for those looking to enjoy a high quality of life with easy access to both nature and city attractions.
Nearest Postcode Areas:
Sewardstone
Population 653
9.3 miles
Located in the historic county of Essex, Sewardstone boasts beautiful countryside views and is home to the Grade II listed Sewardstonebury Manor, a stunning example of Tudor architecture.
Nearest Postcode Areas:
Local Authorities
N11 Postal Town
The N11 postcode includes the following local authorities:
- Barnet
- Enfield
- Haringey
Crime in N11
How safe is this postcode sector?
Crime levels in the N1 postcode area have seen a recent increase, with a focus on theft, burglary, and anti-social behaviour. The local police force has been working tirelessly to address these issues and ensure the safety of residents.
Key Hotspots
Key hotspots in the N1 postcode area include areas such as Islington, Clerkenwell, and Pentonville. These areas have seen a higher concentration of crimes such as theft and anti-social behaviour in recent months.
Historical Crime Issues
The N1 postcode area has a history of crime issues, particularly with regards to theft and burglary. Over the years, there have been reports of an increase in these types of crimes, prompting the local police force to take action.
Current Policing Priorities
The current policing priorities in the N1 postcode area include increasing patrols in key hotspots, working closely with the community to gather information, and implementing crime prevention measures. The local police force is committed to reducing crime levels and ensuring the safety of residents in the area.
According to recent crime statistics, there has been a rise in theft and anti-social behaviour in the N1 postcode area. The local police force has been actively addressing these issues and working to improve the safety and security of residents.
the N1 postcode area has seen an increase in crime levels, particularly in areas such as Islington, Clerkenwell, and Pentonville. The local police force is focused on tackling these issues and prioritising the safety of residents in the area.
Metropolitan Police Police UKEducation
Highest Rated Schools in N11
As rated by Ofsted
- Alexandra Park School
Bidwell Gardens, London, N11 2AZ
Outstanding - Bounds Green Infant School
Bounds Green Road, London, N11 2QG
Outstanding - Garfield Primary School
Upper Park Road, London, N11 1BH
Good - St Andrew the Apostle Greek Orthodox School
North London Business Park, London, N11 1NP
Good - St Paul's CofE Primary School N11
The Avenue, London, N11 1NQ
Good - Our Lady of Lourdes Catholic Primary School
The Limes Avenue, London, N11 1RD
Good - St Martin of Porres Catholic Primary School
Blake Road, London, N11 2AF
Good - Bounds Green Junior School
Bounds Green Road, London, N11 2QG
Good - Holly Park Primary School
Bellevue Road, London, N11 3HG
Good - St John's CofE Junior Mixed and Infant School
Crescent Road, London, N11 3LB
Good

Unlock the full power of postcode insights.
Data is meaningless without context. Reveal the stories behind a neighbourhood, and make smarter decisions with data you can trust. Gain unlimited access to detailed statistics, exclusive reports, and essential tools.
PostcodeArea is grateful to our sponsors for their support.


